Summary: this post provides R code that reproduces the announced ‘reciprocal’ tariffs imposed by the US.
Soon after Trump’s tariffs were announced, it was noted the ‘reciprocal’ tariffs looked suspiciously like the US trade deficit divided by imports.
Ever the skeptic, I couldn’t believe it could be this simple. So. I decided to check it out myself with the help of R and UN Comtrade data. Here’s my answer, neatly documented in R code.
If you’re interested in reproducing this analysis you’ll need to get an API key for the comtradr package. Once you have an API key you need to specify this via set_primary_comtrade_key(you_api_key) at the start of the script.
Tariff rates were sourced from: Ana Lucía González Paz and Seán Clarke (3/4/25), “Trump’s tariffs: the full list”, The Guardian,. Here is a link to the google sheet where the data is stored.
Code block: project setup:
#load packages
library(googlesheets4)
library(tidyverse)
library(countrycode)
library(comtradr)

#set comtrade api key
set_primary_comtrade_key(ref_comtrade_api_key)

ref_gsheet_url<-"https://docs.google.com/spreadsheets/d/1AbPFX21KKfiCr8WWA6fwfPVKAjE5MUCzdWVitV0ZuWM/edit?usp=sharing"

#read data from google sheet
dta_us_tariffs<-read_sheet(ref_gsheet_url)

#add countrycodes
dta_us_tariffs<-  dta_us_tariffs |>
  mutate(iso3c= countrycode(sourcevar=country, origin="country.name", destination="iso3c"))

#assign _KS as as code for Kosovo as per Comtrade country code list (KSV is also used by some providers)
dta_us_tariffs[dta_us_tariffs$country=="Kosovo","iso3c"]<-"_KS"

#create reference list of focus countries
ref_focus_countries<-dta_us_tariffs$iso3c

# get bilateral trade data for US
dta_comtrade <- ct_get_data(
  reporter = 'USA',
  partner=dta_us_tariffs$iso3c,
  commodity_code = 'TOTAL',
  start_date = 2024,
  end_date = 2024,
  flow_direction = c('import','export')
)

# select focus variables and round to billion USD
dta_comtrade<-dta_comtrade |>
  select(ref_year,partner_iso,flow_desc,fobvalue) |>
  mutate(fobvalue= fobvalue/10^9)

# Pivot dataframe by flow type
dta_comtrade<-dta_comtrade |>
  pivot_wider(names_from=flow_desc, values_from = fobvalue)

#calculate trade balance
dta_comtrade<-dta_comtrade |>
  mutate(trade_bal= Export- Import,
         trade_bal_to_m_ratio= round(trade_bal/Import,2)*100)

#join comtrade data with tariff listing
dta_us_tariffs_and_trade_flows<-left_join(dta_us_tariffs,dta_comtrade, by=c('iso3c'="partner_iso"))
There’s more I’d like to do with this data, but for now I thought I’d share my code and the answer: yes. The reciprocal tariffs look almost identical to the trade balance to imports ratio.
Soon after the tariffs were announced the Office of the United States Trade Representative released their ‘methodology’ for calculating the tariffs which more or less confirmed everyone’s suspicions that it was simply the trade balance / imports. @carlbergstrom.com has a great thread (skeet?) on this on Bluesky.
Note: an earlier version of this post had the claimed tariff charged to the US plotted on the y axis instead of the US ‘reciprocal’ tariff (which is just the claimed tariff divided by two).
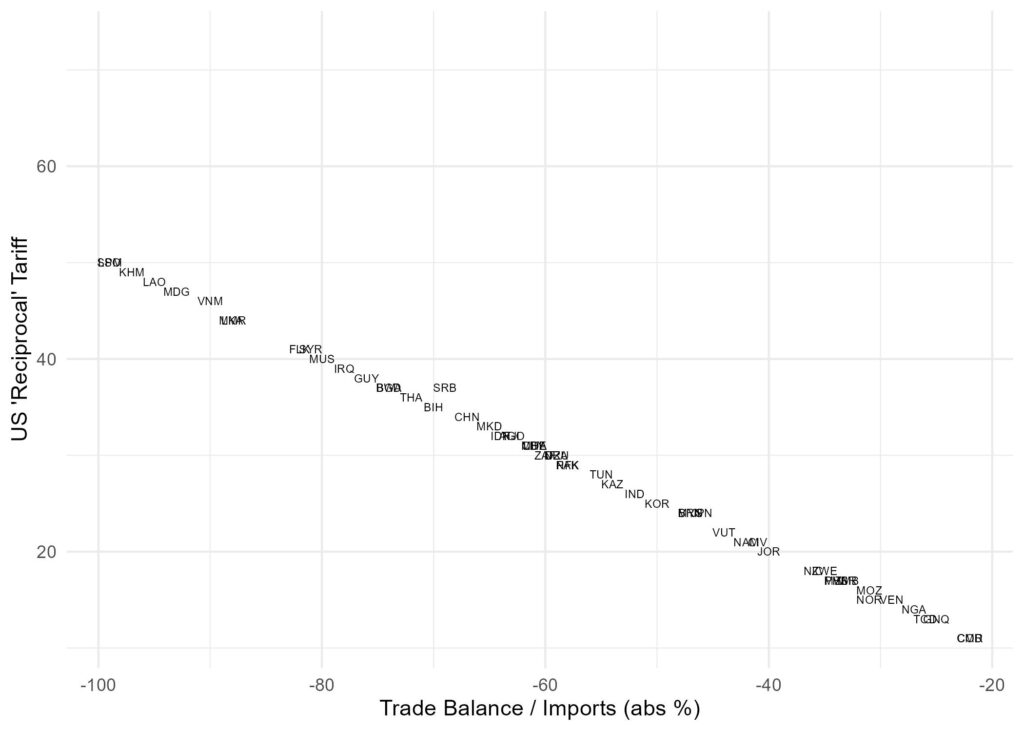
Code block: produce a scatter plot comparing our rates with the announced rates
#create filtered dataframe where tariff > standard rate
#drop EU countries as individual reciprocal tariffs weren't published
dta_plt_us_tariffs<- dta_us_tariffs_and_trade_flows |>
  filter(us_tariffs_applied >10,
         EU == "N")

#plot where tariff != reciprocal tariff
plt_us_tariffs<-ggplot(data=dta_plt_us_tariffs,
                       aes(y=us_tariffs_applied,
             x=trade_bal_to_m_ratio))+
  geom_text(aes(label =iso3c), size=2)+
  theme_minimal()+
  labs(x= "Imports / Trade Balance (%)",
       y="Announced 'Reciprocal' Tariff")

plt_us_tariffs