Just how diverse is the senior leadership of international aid organizations? Colleague Astrid Haas and I recently launched a research project to attempt to answer exactly this for a key dimension of diversity: gender. Data and R code used in the analysis are provided at the bottom of the post
Although I label myself ‘an economist’ at cocktail parties (or would, if I were invited to any), much of my career has been spent in the ‘international development’. For those unfamiliar with what this means, in essence much of my work focuses on the challenges faced by nations, communities and people living in areas with low levels of economic and human development.
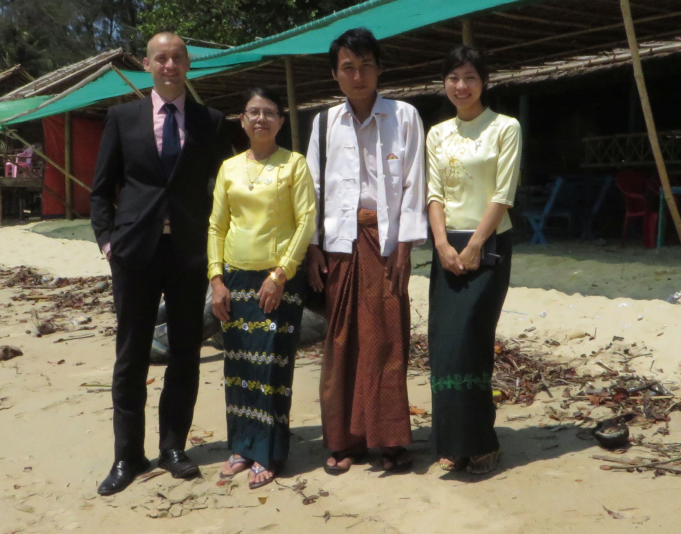
Although this type of work can technically be done from the confines of an air conditioned office, one of my birth rights as an Australian is being irrationally suspicious of authority and hierarchy. Resulting in much of my work being close to the issue at hand. Whether this is interviewing local leaders about how they collect taxes, acting as something of an event coordinator / economic advisor for parliamentarians; or wearing a suit and tie for a meeting that officials had arranged at a local beach.
Reducing the Distance
Aside from this work providing me with abundant opportunities to look foolish by being over-dressed for the beach, it has made me deeply convinced that the more distance you place between yourself and a problem, the greater the chance you’ll get something wrong.
This isn’t to say that there aren’t benefits to taking a ‘birds eye view’, but just that the risks of misunderstanding a problem are likely to increase as the distance increases. Requiring not just that we are aware of this being a problem, but that by reducing this distance we are likely to achieve better results.
Which is one of the reasons I (and many others) advocate for more local participation and diversity in the international development sector. As by narrowing the ‘distance’ between the an aid organization’s leadership team and the beneficiaries of their work, we are more likely to achieve impact in areas the target communities care about – such as by ensuring decision makers are representative of the wider community and the communities they serve.
Diversity in the International Development Sector
Focusing on gender diversity (where the most evidence exists) the news isn’t great: for instance, in the US, women make up 75% of the not-for-profit workforce, but only 43% of CEOs. Whereas UNWomen found that in the UN System women tend to dominate junior positions, but account for a much smaller share of senior leadership. In short, the evidence (and my experience) seems to suggest diversity in the sector looks something like this:
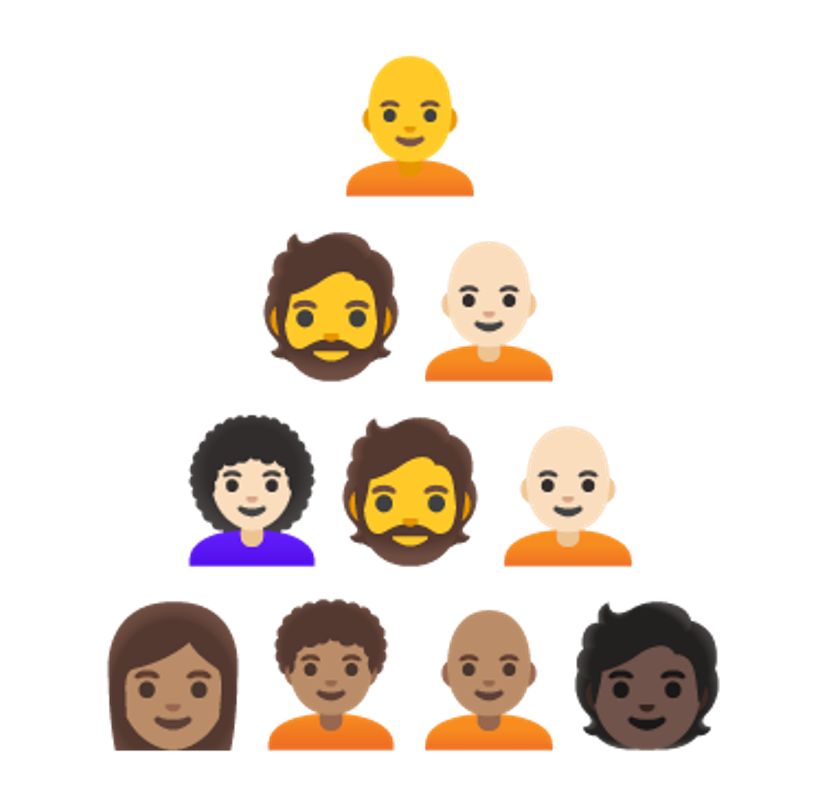
Which is (more or less) the origin story for the project a colleague of mine – Astrid Haas – recently launched to test whether this is true, for a crucial dimension of diversity: gender. As if it is is true, both the sector and its beneficiaries could benefit from addressing the issue.
The Data
To test the idea, we needed data on the composition of senior leadership teams for as many relevant organizations as possible. We therefore first analyzed data from the International Aid Transparency Initiative (IATI) to develop a list of donors, philanthropic foundations, and other organizations that either provide or receive funding in the sector. Based on this, we then created a list of 500+ organizations operating in the sector, selecting a sample of around 150 of the largest organizations.
We then engaged a small team of Ugandan researchers to review each organization’s website to collect data on staff members for each organization. With researchers charged with collecting data on the size, composition and (assumed) sex of each individual listed. Several late nights of data cleaning and analysis later we had our first sample: a dataset with around 1,200 staff members across 72 aid organizations (see end of post for data and R code).
Results: Overall
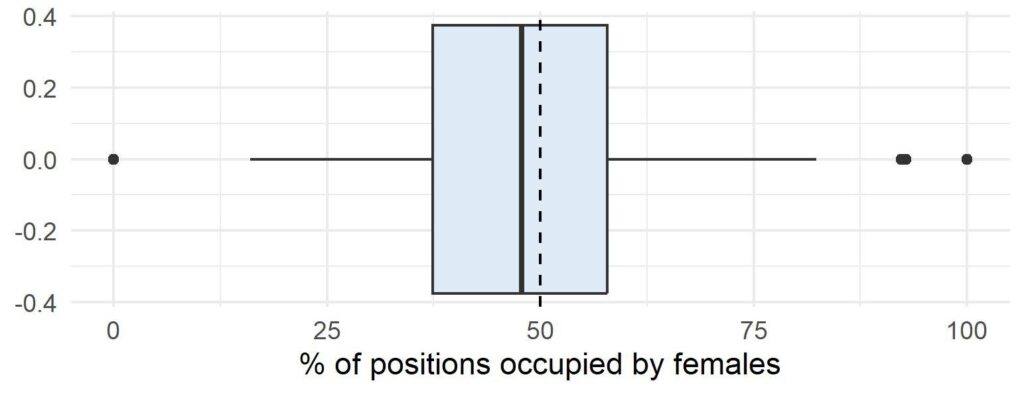
We were pleasantly surprised with our first set of results, with the women making up approximately 50% of the senior leadership positions in our sample (including the senior management, country/regional directors and board members). Hinting that organizations in our sample are close to achieving overall gender parity on average.
Results: Gender Shares by Designation
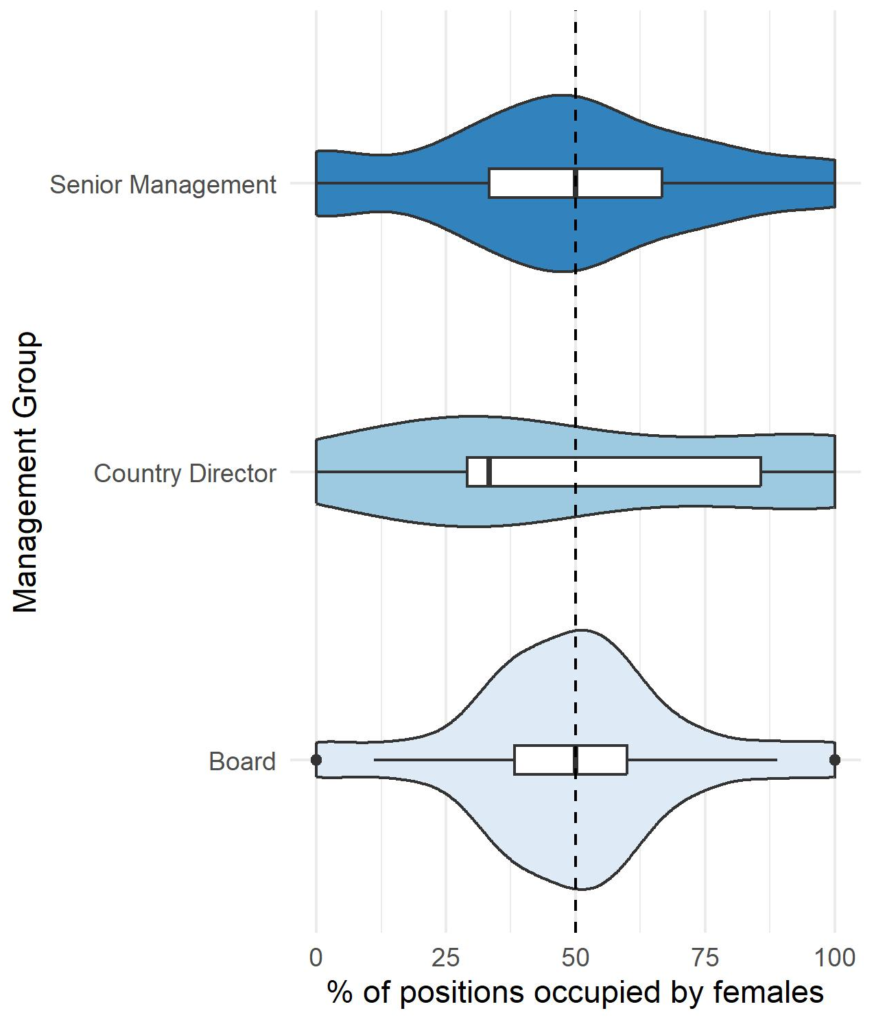
Of course, the responsibilities and impact of an organization’s board is very different from senior management. So we further split the analysis staff according to their designated area of responsibility.
Again, the news was better than expected: with women holding close to 50% of roles across all of the designations. Specifically, women hold 50% of senior management positions, 48% of board positions and 47% of regional and country director positions – differences we can’t make too much of given the size of our sample.
Of course, the world doesn’t work in averages and the picture isn’t exactly rosy when looking at our violin plots for each designation. In short, gender diversity varies significantly across organizations and designations.
Noting that there are less staff holding country / regional director positions in our sample – this designation appeared to perform particularly poorly. With the distribution being less tightly centered around gender parity than the other designations and the bulk of the data being below 50% – indicating the roles are more likely to be held by men for most organizations.
Results: Gender Shares by Designation by Leadership Role
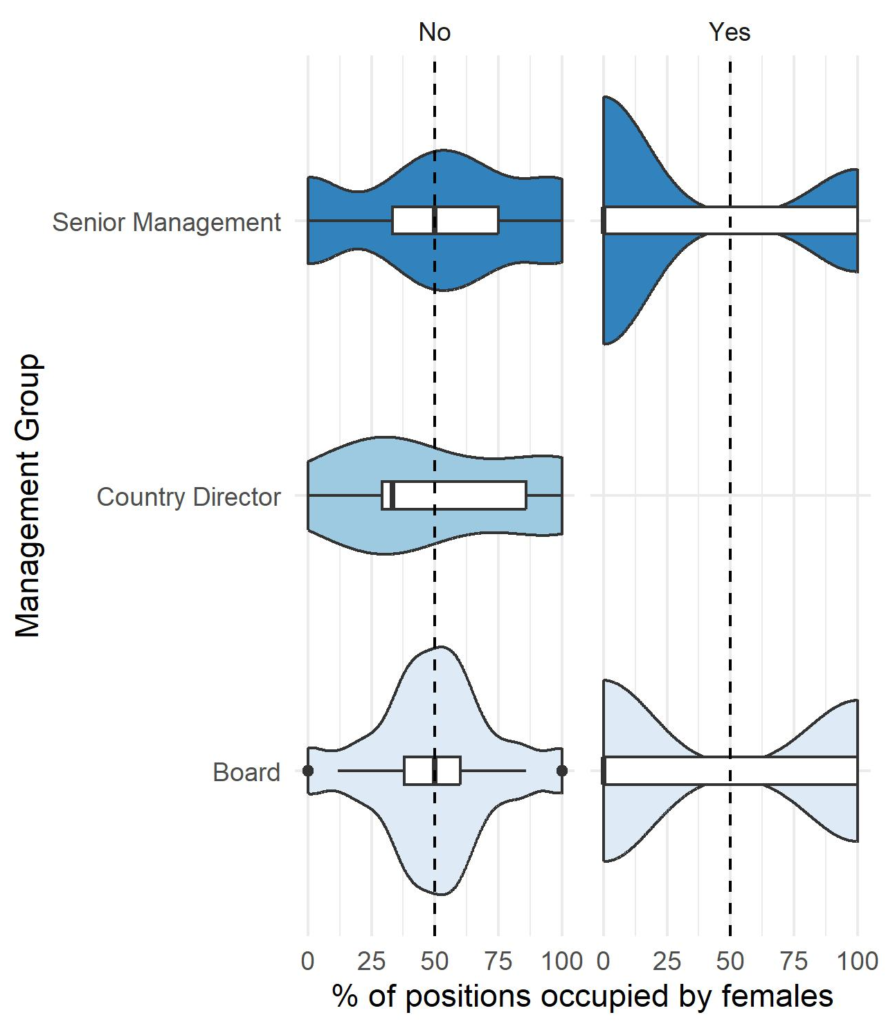
Of course, being given the title ‘Director’ doesn’t always mean you get to direct much of anything. So how does the picture change if we split the sample again based on whether an organization’s leadership holds senior positions in their designation (such as the CEO, Chair of the Board etc)?
Once again, the results weren’t particularly rosy. With it appearing less likely that women hold the most senior positions. In particular, for boards 46% of the most senior positions are held by women, whereas women hold only 32% of leadership positions at the senior management level.
The picture is even more concerning when we look collectively at the most senior positions on boards and senior management, such as the Chairs, Chief Executive Officers, Executive Director or equivalent. With nearly a third of the organizations having men hold 60% or more positions on both their senior management team and board. While more than 40% of organizations in our sample had men in all the available senior positions on their leadership teams.
Concluding Remarks
So what’s to be made of these results?
Well, we’ll be the first to admit that a sample of 72 is unlikely to be representative of an entire industry. We’re also aware that given we intentionally chose organizations that are funded by governments and other major donors, it is plausible our sample is biased – but this is likely to mean gender diversity is worse than our sample suggests. Added to this, given we have taken an educated guess at the sex and designation of each staff member based on the information available on their website (and are yet to seek feedback from each organization), it’s a good idea to tread carefully when interpreting the data.
But, given that: the results of our sample align with the available evidence on diversity in the sector (such as 1, 2, 3 and 4); the sector’s workforce is comprised of more than 50% women; and the sector is increasingly being asked to focus on the issue in its work – it provides a pretty clear signal that the aid sector needs to do more to achieve parity at the senior leadership levels.
What’s Next?
Perhaps as importantly, having only analyzed one aspect of diversity – gender – one which has received more attention and may have had more reform than others – the situation may be worse for other dimensions, such as race. As highlighted in the damming report from the UK House of Commons:
“The aid sector exists to help those in need. But it cannot do that effectively until it addresses the fundamental power imbalances that exist within its structures….”
Sarah Champion, MP
Which is (time and resources permitting) where we hope to focus next. After all, given the importance of the work done by organizations in the sector it makes sense that we’d want to ensure they are effective as possible. Requiring not only that organizations use the best available evidence to inform their work, but that its leadership are as representative of the beneficiaries they serve as possible.
This project was completed in collaboration with Astrid R.N. Haas. For those interested in learning more about the project, please see the dedicated website here: tokenfreedev.org
An article based on the research was also published in the Conversation
Data
As we intend to seek verification of the data from sampled organizations, the dataset below has been anonymized and aggregated. Feel free to contact me with questions or to point out the poor organization of my code.
The R Code
|
1 2 3 4 5 6 7 8 9 10 11 12 13 14 15 16 17 18 19 20 21 22 23 24 25 26 27 28 29 30 31 32 33 34 35 36 37 38 39 40 41 42 43 44 45 46 47 48 49 50 51 52 53 54 55 56 57 58 59 60 61 62 63 64 65 66 67 68 69 70 71 72 73 74 75 76 77 78 79 80 81 82 83 84 85 86 87 88 89 90 91 92 93 94 95 96 97 98 99 100 101 102 103 104 105 106 107 108 109 110 111 112 113 114 115 116 117 118 119 120 121 122 123 124 125 126 127 128 129 130 131 132 133 134 135 136 137 |
#the script below produces a set of high level statistics for analysis #on gender diversity in the international development sector. #the data used has been aggregated to retain anonymity, while still allowing #initial findings of the project to be reproduced. #As this is (to our knowledge) the first time such a survey has been taken #for the development sector, the data (and analysis based on it) should be #considered as 'indicative', as: #the time and resources available were limited #the data collection approach is still being refined #not all staff and /or organizations have been included #and, the surveyed organizations are yet to be contacted to verify the data #To allow the accuracy of data to be reviewed, data was collected on individual staff #org_name -- an id for the organization #n_obs -- the total number of staff records for organization #n_female -- the number of females for the organization by designation #sex -- their sex was based on a combination of the pronouns used, names and photos #(and thefore may not match their gender) #designation -- management levels were categorized according to whether the person #was a board member and part of the senior management team (incl. regional/ country directors) #this was typically based on information available on the website (based on the titles used for an org) #lead_at_designation_level -- this denotes whether the staff held 'lead positions' #in the relevant designation. For instance, CEOs for senior management teams, #chairs for boards etc. # Set up ---- #load tidyverse packages library(tidyverse) #import data dta_draft_results_summary<-read_csv("./Data/draft results summary table.csv") #calculate the overall % of females in dataset - approx 50% sum(dta_draft_results_summary$n_female)/sum(dta_draft_results_summary$n_obs) #calculate the % of women by designation sum_gender_share_by_desig<-dta_draft_results_summary |> group_by(designation) |> summarize(pct_females = sum(n_female)/sum(n_obs)) #Although the average share is lower, still approximately 50%. sum_gender_share_by_desig #calculate the % of women by designation and whether they hold a head position #at designated level (ie Chair of Board, CEO etc) sum_gender_share_by_desig_and_head<-dta_draft_results_summary |> group_by(designation, lead_at_designation_level) |> summarize(pct_females = sum(n_female)/sum(n_obs)) #although the shares are still close to 50%, women appear #consistently less likely to hold leadership positions on #boards and the senior management teams of surveyed organizations sum_gender_share_by_desig_and_head #what pct of organizations have only men in their boards / senior management? = 2 sum_org_totals<- dta_draft_results_summary |> group_by(org_name) |> summarize(total_obs = sum(n_obs), total_females= sum(n_female), pct_females = total_females/total_obs) #calculate table(sum_org_totals$pct_females ==0) #what proportion of organizations have less than 40% women occupying #senior leadership positions? sum_pct_orgs_no_women<- table(sum_org_totals$pct_females<0.4 ) #indicates that 30% of organizations have leadership teams with less than 40% women prop.table(sum_pct_orgs_no_women) #what pct of organizations have no women holding leadership positions #at senior levels? sum_org_totals_desig_leads<- dta_draft_results_summary |> group_by(org_name, lead_at_designation_level) |> summarize(total_females= sum(n_female)) |> pivot_wider(names_from =lead_at_designation_level, values_from = total_females) #43 % of organizations have the most senior positions occupied entirely by men prop.table(table(sum_org_totals_desig_leads$Yes==0)) #restrict analysis to senior management sum_org_totals_desig_leads_senior_manage<- dta_draft_results_summary |> filter(designation != "Board") |> group_by(org_name, lead_at_designation_level) |> summarize(total_females= sum(n_female)) |> pivot_wider(names_from =lead_at_designation_level, values_from = total_females) #suggests that 31 % of organizations have no women holding senior positions on #their senior management teams prop.table(table(sum_org_totals_desig_leads_senior_manage$Yes==0)) #visualize the pct of females by group #create data for plot - distribution by designation plt_gender_share_by_desig<-dta_draft_results_summary |> group_by(org_name, designation) |> summarize(pct_females = sum(n_female)/sum(n_obs)) #create plot - distribution by designation plt_female_share<-ggplot(data = plt_gender_share_by_desig, aes( x= pct_females*100, y=designation)) + geom_violin(aes(fill=designation ))+ labs(x = "% of positions occupied by females", y= "Management Group") + geom_boxplot(width=0.1)+ scale_fill_brewer(palette="Blues")+ xlim(c(0,100))+ geom_vline(xintercept=50, linetype="dashed", color = "black")+ theme_minimal() #display and save plot plt_female_share dev.off() ggsave(plt_female_share, filename ="./Plots/female share by designation.jpg", width=6, height=5) #create data for plot - distribution by designation and leadership position plt_gender_share_by_desig_lead<-dta_draft_results_summary |> group_by(org_name, designation, lead_at_designation_level) |> summarize(pct_females = sum(n_female)/sum(n_obs)) #create plot - distribution by designation and leadership position plt_female_share<-ggplot(data = plt_gender_share_by_desig_lead, aes( x= pct_females*100, y=designation)) + geom_violin(aes(fill=designation ))+ labs(x = "% of positions occupied by females", y= "Management Group") + geom_boxplot(width=0.1)+ scale_fill_brewer(palette="Blues")+ xlim(c(0,100))+ geom_vline(xintercept=50, linetype="dashed", color = "black")+ facet_wrap( .~ lead_at_designation_level)+ theme_minimal() #display and save plot plt_female_share dev.off() ggsave(plt_female_share, filename ="./Plots/female share by designation and lead.jpg", width=6, height=5) |